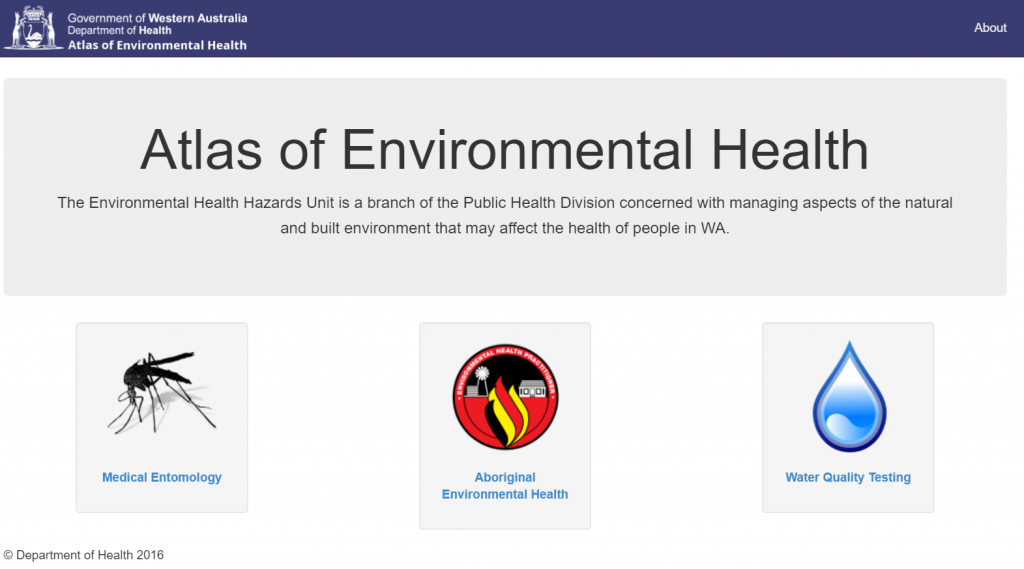
Two weeks ago, the Western Australian Department of Health launched the Western Australian Atlas of Environmental Health covering Medical Entomology, Aboriginal Environmental Health and Water Quality Testing. This has been the result of a lot of work by the team involved, including the Department of Health, our team at Gaia Resources, and with support from the Cooperative Research Centre for Spatial Information (CRCSI).
The Atlas of Environmental Health dashboard
Dr Peter Neville launched the project at a meeting of Local Governments, the end users of the system, last week. Then Pete and I travelled across to Canberra to present on the project to the National Arbovirus and Malaria Advisory Committee (NAMAC). After these two presentations we thought it was an appropriate time to post a blog about it (although regular readers will have seen glimpses of the project in other blogs like this one).
The Atlas currently contains three modules;
- Medical Entomology,
- Aboriginal Environmental Health, and
- Water Quality Testing.
Medical Entomology is focussed on mosquitoes, specifically around efforts to control them, and the diseases that they carry. This is the flagship of the modules, as it’s had the most attention from the team. This module actually has three components;
- The web site which has data entry forms, reports and a field guide,
- The mobile tool, for remote offline data entry, and
- The web based help manuals.
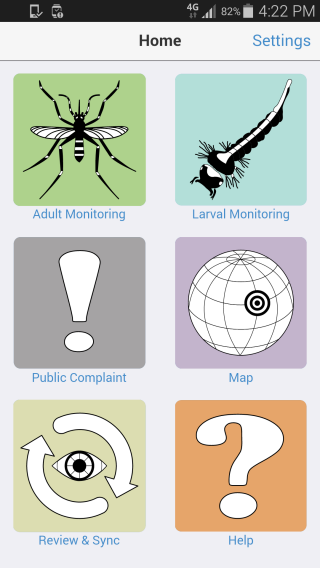
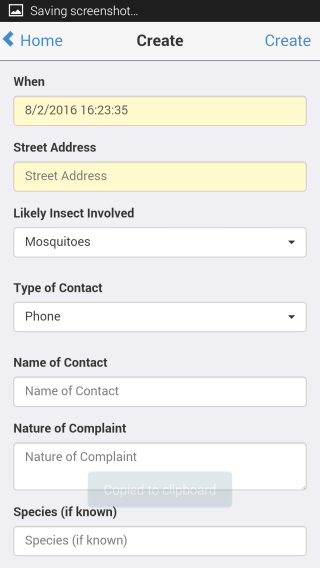
The mobile tool for the Mosquito Monitoring side of things is live in the Google Play and iTunes stores right now – but you need to be cleared by the Department of Health to have an account on it, as this submits data to the underlying production servers. Since we don’t have a test mobile app at this point, I’ve included a screenshot or two below.
A couple of screenshots from the mobile app
The mobile app allows Environmental Health Officers (EHO) to undertake adult and larval mosquito monitoring (as well as to lodge public complaints) in the field, out of mobile reception. The whole app is designed to be a useful addition to the EHO’s day, where they can lodge these records from the field. We’ve even developed it in such a way that one EHO can set the traps in the evening, synchronise the mobile tool, and another EHO can synchronise the next morning, and then go and collect the deployed traps afterwards.
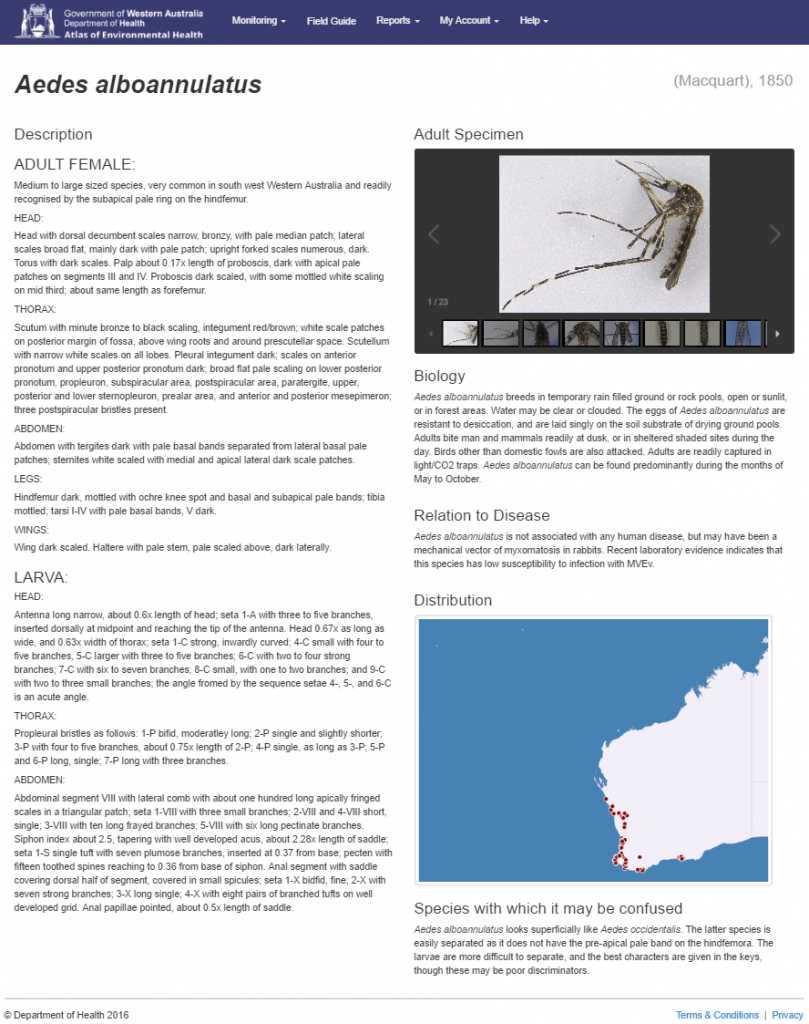
The web site component replicates the forms in the mobile tool (well, it’s actually the other way around, really) and allows for on-line entry of the same data. In addition, we’ve added a field guide into the web site so that there is a solid reference base for the EHOs to use to learn more about the mosquitoes in their area. The field guide is built upon information from published sources, and is being updated and edited by Departmental staff.
An example of the type of information in the field guide
Finally, the powerhouse of the system is really the reporting functionality. This allows EHOs to get into the system and start to look at their data, identify trends and start to plan their work more effectively. The reports allow the EHOs to do things like:
- Chart the abundance of mosquitoes by species,
- Chart the abundance of mosquitoes at each of their sites,
- Map the abundances across their sites,
- View a map of all of the public complaints that have been lodged, and
- Chart and view the notifications of diseases borne by mosquitoes.
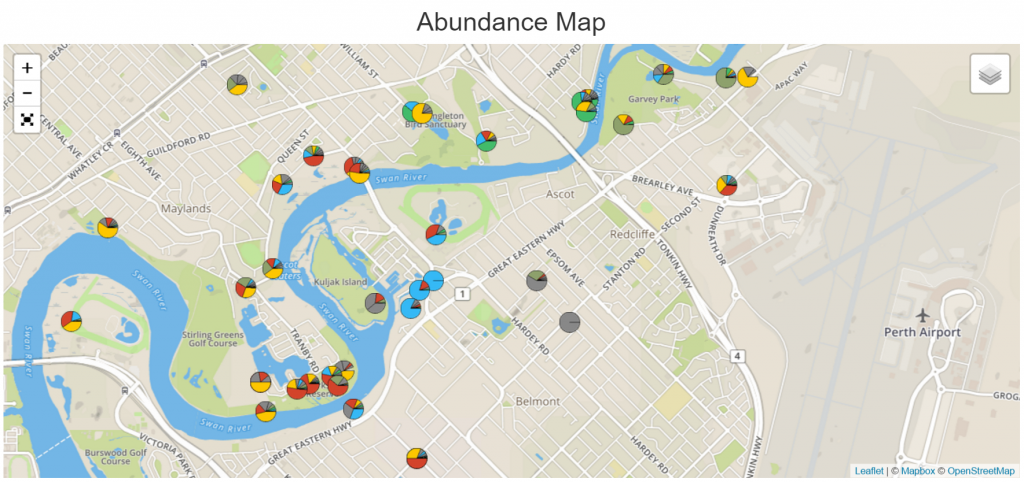
An example of the abundance map is shown below (without the legend – this is pretty sensitive information) which shows you the pie charts present on each site – each of these is clickable to view more information on the site, and you can then go off to review all the data from that site.
An example of the abundance map
There are several other reports in the system (such as the ones we’ve developed for the Sentinel Chicken program) and there are more underway. One of the key things about this system is that the Local Governments can actually share data with other Local Governments, and the Department of Health data is available to each of the Local Governments straight away – this is a great step in ensuring cooperative mosquito management can occur. Of course, all of the data can also be exported from the system to allow further analysis to occur.
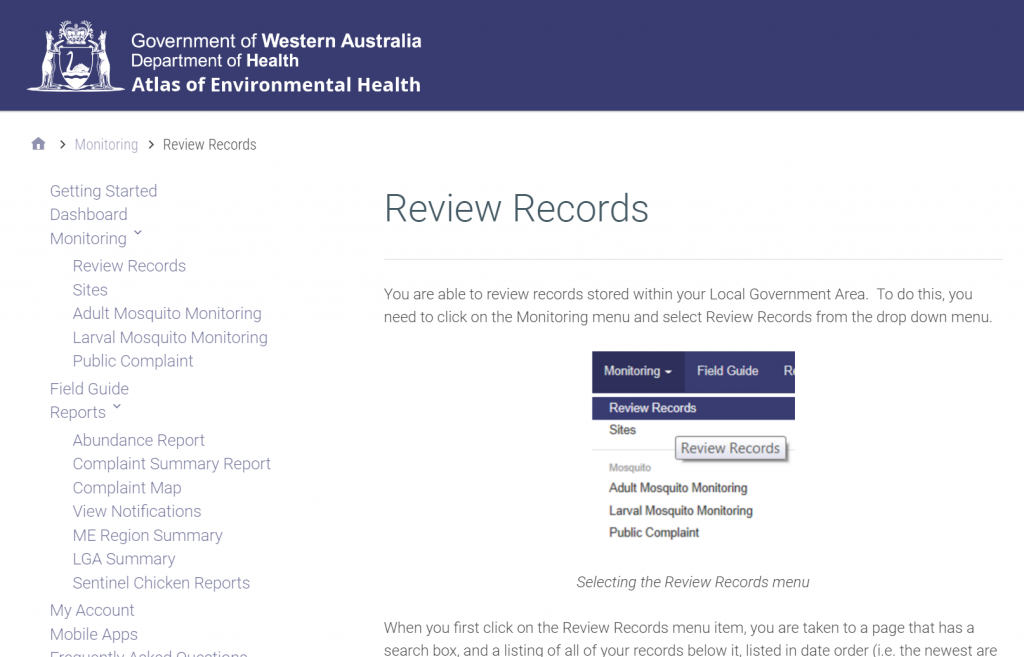
The final part is the on-line help system, and this has been something I have been working on with Pete as well. We set up the framework for the Help system in WordPress (similarly to how we developed our online GRID manual). This means that the Help text is readily editable and manageable by the team at the Department, so that they can maintain the system themselves.
An example of the help system
The Medical Entomology system has been really well thought out by Pete and his team, and this is shown in the examples and screenshots that you see above.
 Aboriginal Environmental Health
The Aboriginal Environmental Health module has been developed to assist the various groups that undertake Environmental Health activities in remote Aboriginal communities to report on their activities – simplifying their reporting process.
This module is less detailed than the Mosquito one, but it basically includes a form for data entry of the information that is provided, and then a report can be generated from the system to summarise the activities for particular communities across particular timeframes.
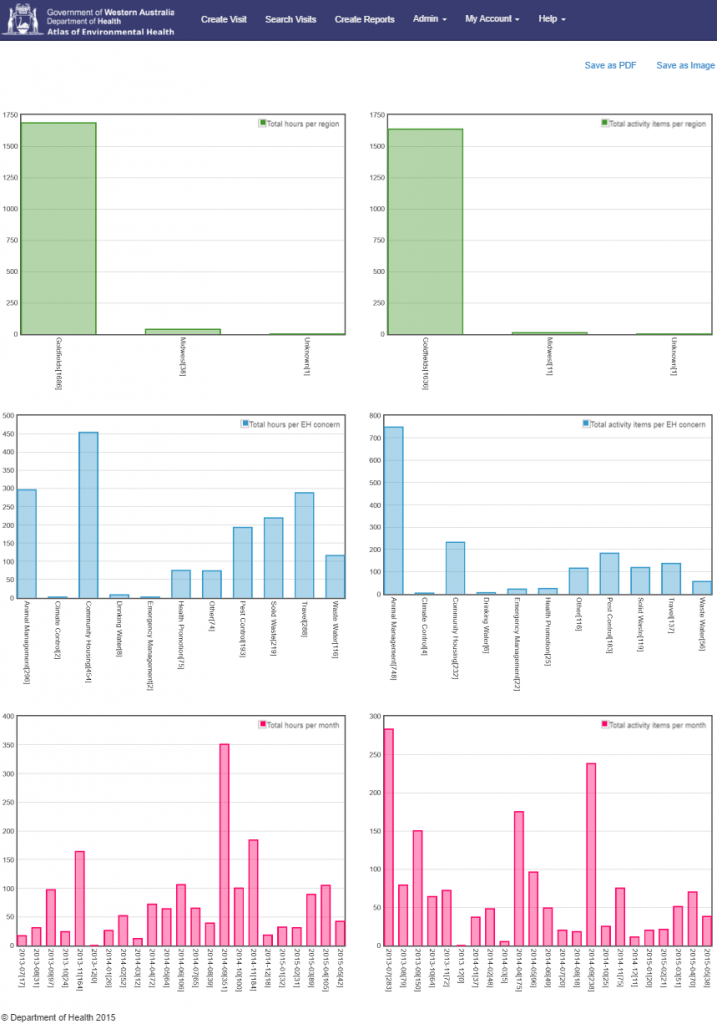
The report itself is one of the more powerful ones here – it amalgamates the data in the system and spits out a readily printable report (via PDF or image export), showing the total hours, number of activities and the hours per month for each of the providers.
An example report from the Aboriginal Environmental Health module
This report is interactive, allowing for each of the reports to be clicked on and enlarged for specific printing and embedding in Powerpoint. It has become a great tool for the team to use and rollout of this should be occurring in the near future.
The Water Quality module is our simplest module in the system – designed around the specific format for a spreadsheet currently used by the Departmental staff to monitor Water Quality in various locations.
This module is based around a workflow by which Departmental staff load the spreadsheet into the system, and from there the system allows for querying of the data, and printing of a number of reports.
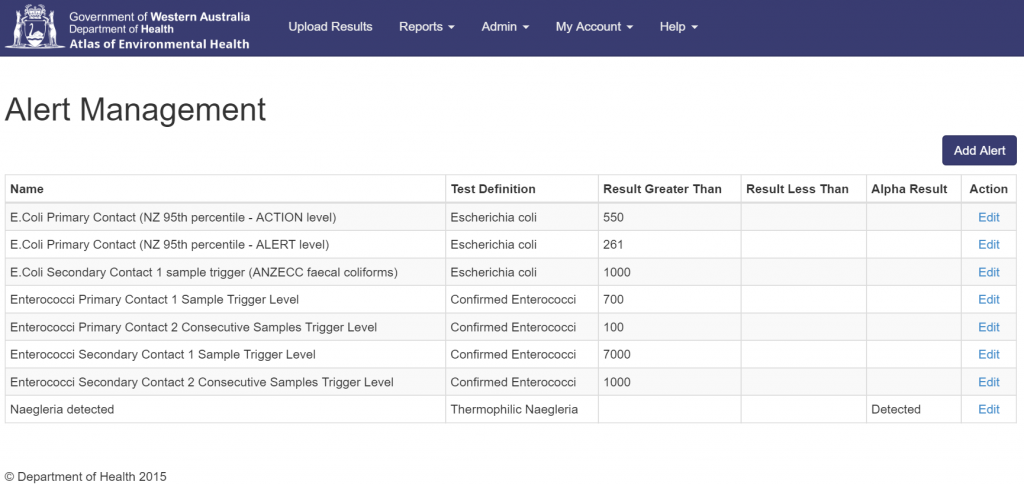
More importantly, the system has an Alert function built in, whereby the administrators of the system can define a particular threshold for a parameter, and have the system perform an action (in this case, emailing an alert to the right staff member).
The Alert Management setup in the Atlas Water Quality module
The Water Quality module underwent testing late last year, but has not yet been used in production (the screenshot above is from our testing site).
The Atlas has been one of our “Big Projects”, and for the last few years has kept various staff members pretty busy on a range of tasks required. As a result of all this work, and the recent presentations, there has been considerable interest in the system from other jurisdictions, and I will be off on the road again in the next few weeks to do more presentations upon it. It’s been a lot of work from our internal team, including a lot of time from Benny and Serge on the project.
It’s no small testament to the work that Pete and his team have put into the system that it’s already being seen as very useful and effective, and in the way we’ve implemented it, using the modularised components, and the ability to customise them into the future, that this will continue to be of great use to the Department of Health in WA and to the wider Environmental Health community in Australia.
If you want to know more about the system, please contact Dr Peter Neville in the first instance at the Department of Health (peter.neville@health.wa.gov.au); we can then answer technical queries once Peter has passed them onto us. Otherwise, leave us a comment below, or follow up with us on Facebook, Twitter or LinkedIn.
Piers

Comments are closed.