Natural Resource Management (NRM) staff and Landcare groups have been using our Geographic Reporting and Information Database (GRID) system for years to record natural resource management activities on the ground (e.g. beach cleans, revegetation plantings and capacity building events). The online mapping application has also become an important interface between external volunteers and NRM group staff responsible for managing grants and reporting progress to government.
A particular Activity (one of those activities they do on the ground) can include point, line and area features with a set of fields. For example, a Weed Control activity could have a field for recording the ‘Method Used’as well as the a point location where the weed was removed, or the area that was treated. The important concept here is that an NRM activity is not limited to one type of geometry and may have management methods that lend themselves to multiple geometries, or you can have a single geometry in one Activity. As an example, the Dieback Information Delivery and Management System (DIDMS) utilises Activities to record point locations (disease points) as well as lines that help them to understand the coverage and spread of Phytophthora cinnamomi. Their focus is around reducing risks of human vectoring of the pathogen within priority areas of Western Australia.

The DIDMS platform – which is being showcased at the Dieback Conference today (more on that from Alex and Tracey soon!)
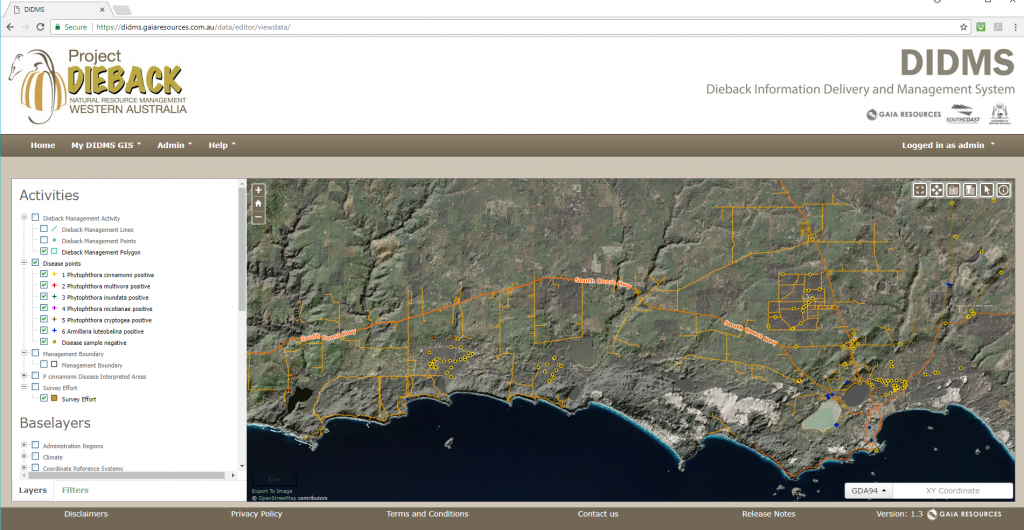
Viewing this disease point data against base layers like imagery, roads, cadastre and a hillshade (Figure 1) provides a powerful interpretive tool to look at the relationships between disease data and topography, transportation networks and land use. The spatial relationships here can help the Dieback Project with planning decisions for future survey and management work. The aforementioned hillshade is also handy for other activities to do with catchment planning, fire risk planning etc.
Thanks to investment from the State NRM office in GRID, a new feature about to be released allowing this visualisation to be improved even further. An Activity can now be symbolised based on unique values in a field. For example, let’s say that a disease point Activity in DIDMS contains a field for ‘Vegetation Condition’ [Pristine, Excellent, Very Good, Good, Degraded, Completely Degraded]. The GRID Administrator can set up and display a different set of colours, fonts and pattern properties for each of the values and thereby allow users to observe and interpret their data in new ways.
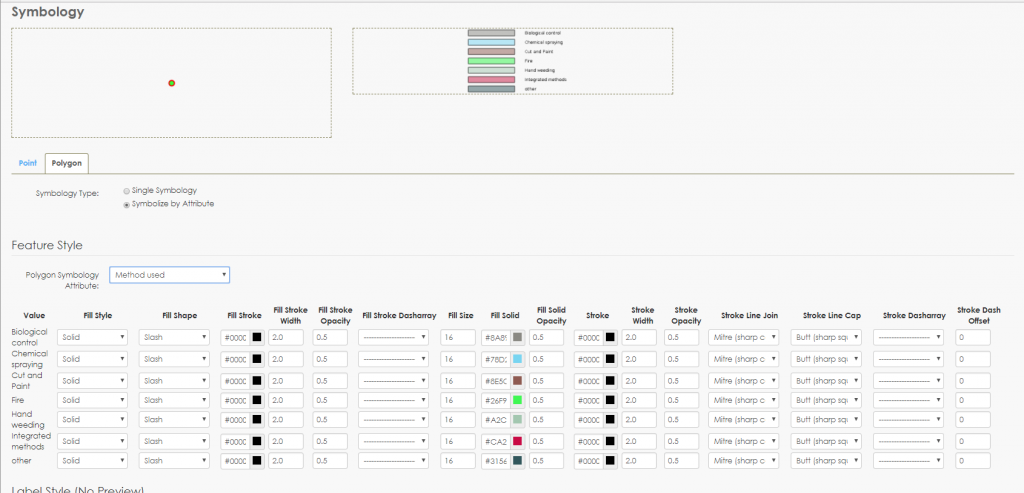
So here’s a sneak peek of the new symbolise by attribute functionality. In this case the Administrator can take the Weed Control Activity (which has point and area geometries) and choose a field called “Method Used,” and then have a number of configurable symbol properties to adjust how each of these appears in GRID.
The Symbology Editor in GRID
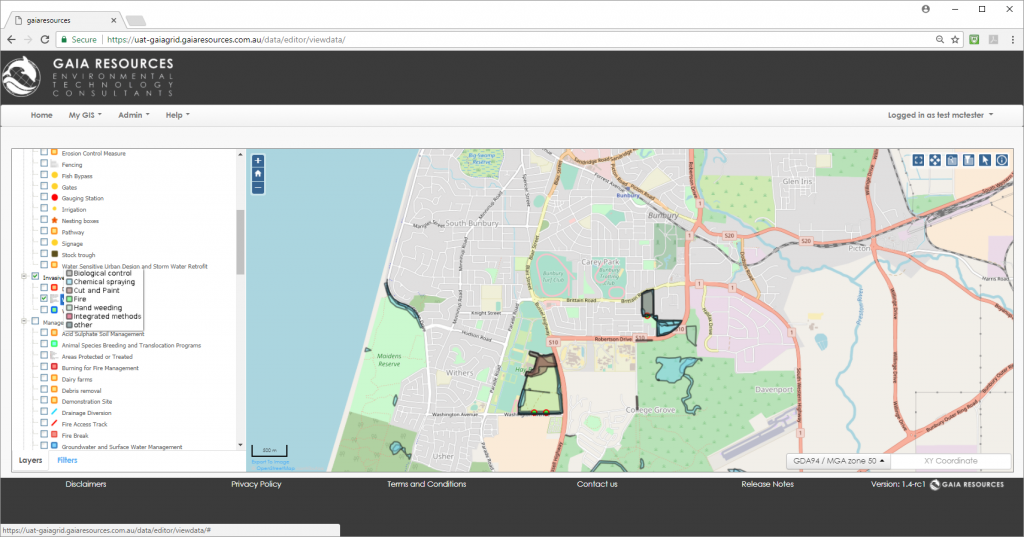
Once the properties are saved, the GRID community can view the new symbology instantly on their map view.
Weed Control area features symbolised by attribute
This “symbolise by attribute” feature, as we call it, has been a lot of hard work by the team here internally, as well as from our NRM “champions” in each of our client organisations, who have helped us design the feature, tested it and are about to embark on more testing in other new components (such as a new permissions model). While the State NRM funded development work is coming to a close, it’s delivered a lot of high quality outcomes for the NRM community that uses GRID, and we’re really please to be able to roll out these upgrades.
If you’re interested in GRID, please feel free to drop me an email, or call either myself or Piers in the Perth office on (08) 9227 7309. Or, as usual, you can start a conversation with us via Facebook, Twitter or LinkedIn.
Chris


HI Chris
While I am sure the NRM groups will appreciate symbolise by feature, it’s no big deal in GIS software. Have NRM groups actually gone backwards in GIS by taking up with GRID? Why aren’t we just giving them better mapping capacity with QGIS?
cheers
Hey Simon!
I wouldn’t think any of our NRM clients (including the GIS staff) would think that GRID means they are going backwards. GRID is designed as an easy to use online GIS for the NRM community, and most of the users we work with don’t worry too much about symbolisation details, which I suspect is why it was never on the (NRM community led) design or roadmap in the first place. But it came up in the first community roadmap session, and we sought out funding, and built it. I think that’s pretty responsive.
There’s heaps of other benefits to the clients that use GRID apart from these sorts of upgrades. And for those that are more “power users” (like you), we do pair them with QGIS and have been doing so for years, along with our NRM specific training course. More news on that to come as we’re about to shake up that training pretty significantly 🙂
Great to hear from you!
Piers