A while ago, Piers set another of his “challenges” about looking at sharks and dolphin sightings in the Swan River – and seeing if people were confusing the two.
Tracey started collating shark sighting data (as much as we could find from various media sources, and various shark warning sites) and compiling it into the Coastal Walkabout citizen science dataset. This was a lot of detective work, and had Tracey scouring all sorts of different places for this data (mainly from December 2015 onwards), such as the Surf Life Saving WA Twitter feed and the Facebook page Dorsal Perth Shark Reports – a bit like some historical blogs that Piers wrote about a while ago.
Once the data was all loaded, we created an interactive web map, which you can see below. The web map will allow you to drag the time slider across to view a range of data from different dates, and zoom in and out (it’s another implementation of CartoDB, similar to the one I wrote about previously). The data is linear in this view, flashing on and off within time ranges.
Following on from just displaying dolphin and shark sightings, we decided to compare the two in order to find any significant correlations.
These were then brought through QGIS as a Comma Separated Values (CSV) spreadsheet, ready for some analytical processes. The first step was to calculate a 1km buffer around the locations of the dolphin watch sightings. Next was to intersect the shark sightings with the 1km dolphin watch sighting buffers. In order to find date and distance intervals between sightings I wrote a simple script to do the actual legwork. While we didn’t have heaps of data to work with, the calculations worked and could lead to further studies, and here’s some highlights:
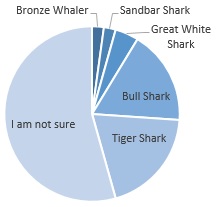
- 46 shark sightings intersected with a 1km buffer around dolphin sightings.
- Of these 46, they were logged as the following species:
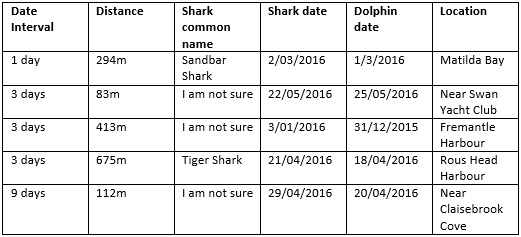
- Some of the closely correlated results can be seen in the following table:
This sort of analysis is just the start of the type of analysis that you could do with citizen science data (assuming you can get people interested in your subject) and by doing spatial investigations of this data it really can show some interesting correlations.
So were people confusing dolphins and sharks? Well, we think the jury is still out, but it’s certainly possible – more observers, and more data would definitely help solve that question! If you want to know more about how we did this, drop me an email, or start a conversation via Twitter, LinkedIn or Facebook.
Jake


Comments are closed.