In this blog, we’ll explore some of the challenges and solutions around managing the spatial aspects of biodiversity data.
Claire recently wrote about how she loved the way nature always had such elegant answers to complex problems (see her blog here). Researchers and environmental scientists often observe these elegant answers when they are out in the field collecting data.
Whether it is the way that plant seeds have evolved to propagate through the use of wind or fire, or a symbiotic relationship that benefits both plant and animal species.
Channelling the Samuel review of the EPBC Act, if we are going to get serious about arresting the decline of species and ecosystems in Australia, we need to do much more to connect the dots of biodiversity data. The review found that “in the main, decisions that determine environmental outcomes are made on a project-by-project basis, and only when impacts exceed a certain size. This means that cumulative impacts on the environment are not systematically considered, and the overall result is net environmental decline, rather than protection and conservation.” (source: Independent review of the EPBC Act – Interim Report Executive Summary)
Gaia Resources is currently developing two separate biodiversity data management projects in Australia that are helping State and Federal government agencies to streamline biodiversity data submission, increase accessibility to biodiversity data and hopefully, in turn, support decision making and improve environmental outcomes. We are rapidly approaching the launch of both these projects – so stay tuned for more details to come!
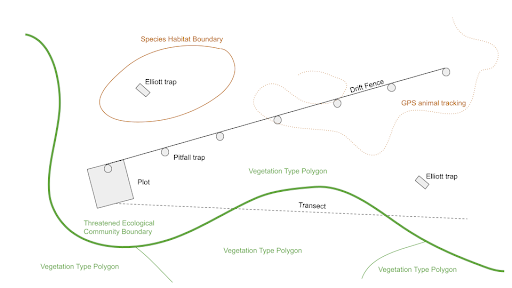
We are helping to join the dots by enabling biodiversity data to be aggregated and made more readily available as a public resource. This type of data – including species occurrence data, systematic surveys and vegetation associations – comes in many forms and from multiple sources. Researchers and environmental scientists have employed different methodologies across our vast continent and territories to collect data for their particular project or area of study. Depending on the nature of the survey, field biodiversity data can be collected as point occurrences or observations, transect lines, plots, traps, habitat survey areas and quadrats (as shown below).

A schematic representation of different types of biodiversity survey types including points, tracking data, transects, traps, plots and habitat surveys.
The observed absence of a species within a defined survey area/site, and time of the survey, are also important data elements for ecological research. Adding to that data complexity is the fact that over the past few decades, technological advancements in GPS (Global Positioning Systems) and apps on handheld devices have changed the way we record things like coordinate locations and levels of accuracy. Technological advancement has also impacted the volume of information we can gather with the time and resources we have available.
To have a chance of aggregating all this data from different sources in a meaningful way, there is a need to apply a consistent approach, or standard, to the biodiversity information. Apart from the considerable challenges standardisation presents from a taxonomic perspective in classifying species, there are also several spatial data challenges, which I’ll focus on here – more on the use of standards and varying approaches to using them will be coming in a later blog.
One key challenge is knowing and specifying the spatial coordinate system of incoming data, so that any repository can transform many project submissions into a spatially consistent system. Once you know the reference system, it is then possible to assess whether the data is positioned in a logical place – on the Australian continent or its Island Territories, for instance.
Another big one has been how to handle different geometries of data (e.g. point, line, polygon) describing the same type of thing in the field. Take an example of a 30 year old report that lists a single point coordinate referencing a 50x50m plot area, but with no other information like the orientation of that plot. Do we materially change a plot reference to make that a polygon shape, based on a snippet of information in the accompanying report? What happens when some of the information we need is missing, or the method described in the report is ambiguous? As system developers, we are avoiding anything that amounts to a material change to the source data; instead, systems should be designed to put some basic data quality responsibilities to solve these mysteries back on the authors of the data.
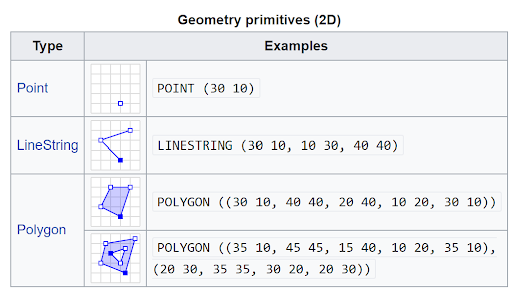
Finally, we have the issue of spatial topology in biodiversity data. Once you get into the realm of transects and areas, it becomes tricky to represent that spatial location using text based standards. Technology provides an elegant – although arguably not that user-friendly – solution through something like a Well-known text (WKT) expression. This standard form can simplify a line or polygon into a series of coordinates that become one column in a dataset, like that shown below.

Points, lines and polygons can be represented by a text string where the discrete numbers are coordinate pairs (Source: Wikipedia)
Instead, we are looking to leverage the open Geopackage format. Generally speaking, this format gives us an open and interoperable approach that can be used across a range of GIS software applications. The Geopackage format has been around for years, and provides a more accessible alternative to proprietary geodatabase formats that you can only really use in a particular GIS software. It also allows configuration and customisation through the SQLite database on which it is based.
Finally, we have a responsibility to ensure that the biodiversity data is FAIR (Findable, Accessible, Interoperable, and Reusable). In my view, this is a challenge as much about data coming into a system as it is about the user experience of people trying to interact and get data out of a system. Spending some quality time on both ends of the data chains is very important – and that’s why we’ve been working heavily on design for these systems, too.
By its nature, aggregating data from multiple sources across space and time comes with a suite of challenges, some of which I’ve touched on here. So these are some of the spatial challenges we’ve been working on in the spatial biodiversity data area, and our expertise in both biodiversity data and spatial data has been very useful in these projects.
If you want to know more about biodiversity information or spatial data, we would love to hear from you. Feel free to drop us an email or start a conversation on our social media platforms – Twitter, LinkedIn or Facebook.
Chris

Comments are closed.